%20{%20:root%20{%20--deepread-stroke:%20%23E5E7EB;%20}%20}%20.dark%20{%20--deepread-stroke:%20%23E5E7EB;%20}%20%3c/style%3e%3crect%20x='40'%20y='30'%20width='220'%20height='260'%20rx='28'%20ry='28'%20stroke='var(--deepread-stroke)'%20stroke-width='16'%20fill='none'/%3e%3cpath%20d='M180%2030v52c0%2010%208%2018%2018%2018h62'%20stroke='var(--deepread-stroke)'%20stroke-width='16'%20fill='none'/%3e%3cline%20x1='70'%20y1='130'%20x2='200'%20y2='130'%20stroke='var(--deepread-stroke)'%20stroke-width='16'%20stroke-linecap='round'/%3e%3cline%20x1='70'%20y1='165'%20x2='200'%20y2='165'%20stroke='var(--deepread-stroke)'%20stroke-width='16'%20stroke-linecap='round'/%3e%3cline%20x1='70'%20y1='200'%20x2='170'%20y2='200'%20stroke='var(--deepread-stroke)'%20stroke-width='16'%20stroke-linecap='round'/%3e%3c!--%20green%20download%20arrow%20in%20bottom%20right%20corner%20--%3e%3cpath%20d='M210%20202v58'%20stroke='var(--deepread-accent)'%20stroke-width='18'%20stroke-linecap='round'/%3e%3cpath%20d='M195%20245l15%2015%2015-15'%20fill='none'%20stroke='var(--deepread-accent)'%20stroke-width='18'%20stroke-linecap='round'%20stroke-linejoin='round'/%3e%3c/svg%3e)
Metrics to Measure the ROI of Document Workflow Automation (2026)
The metrics that measure document workflow automation ROI: baselines, formulas, cost per document, STP rate, payback, and how to read the statistics.
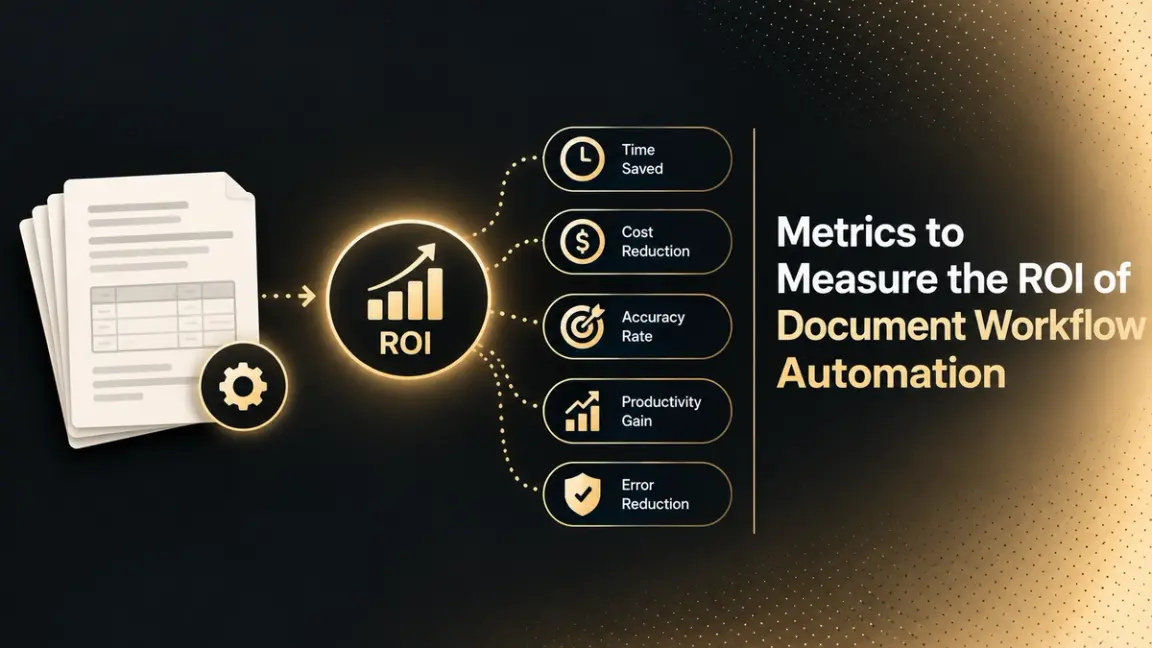
Most automation business cases lean on one number, usually hours saved. That undersells the return and invites doubt, because a single figure can't show whether processing got faster, cheaper, more accurate, or less risky. This guide covers the metrics that make an ROI case hold up: what to baseline before launch, the core metrics by category, how to collect the data, the formulas behind them, the costs teams forget, and how to read the published statistics.
Who This Is For
- Operations and finance leaders building a business case for document workflow automation.
- Project owners who need to show whether a pilot actually paid off.
- Teams comparing vendor ROI claims and needing a way to judge them.
Start With a Baseline
Every metric below is a before-and-after comparison, so the baseline decides whether the numbers mean anything.
- Inventory the highest-volume, highest-friction processes (accounts payable, claims intake, onboarding, regulatory reporting) and pick the one you'll measure first.
- Price the current cost per document. Include labor, error correction, storage, and compliance overhead, not just data entry time.
- Record volumes, cycle times, and error rates for the same period you'll compare against later.
- Note what's outside the process. Seasonality, headcount changes, and volume swings can distort a comparison if they aren't tracked.
Where possible, express results in metrics finance already reports, such as cost per transaction, days sales outstanding, or audit findings, so the ROI case connects to numbers the business already trusts instead of a new set of automation-specific ones.
The Core Metrics
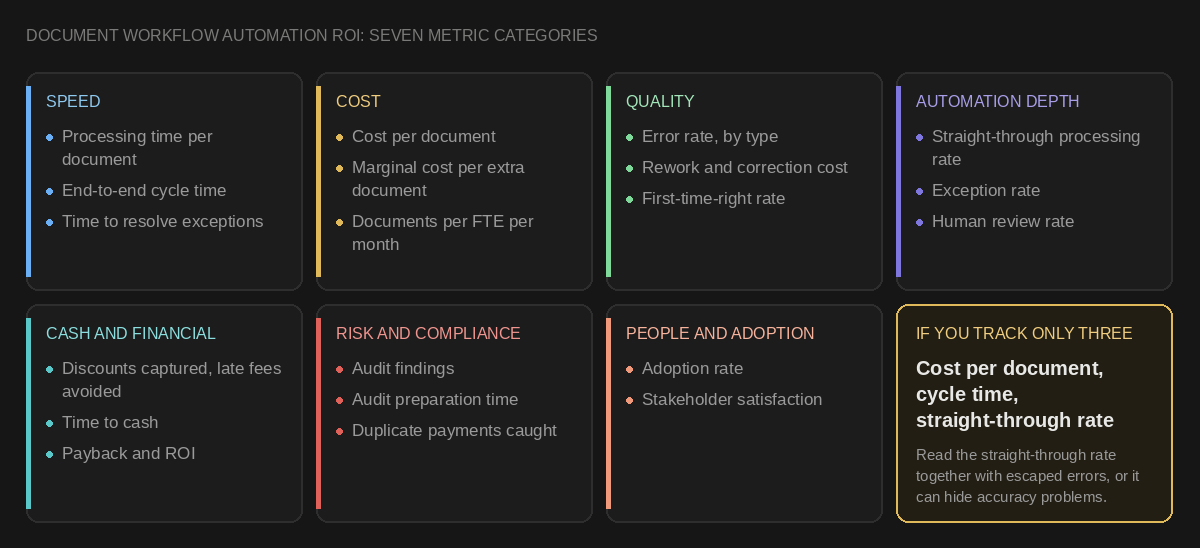
Speed
- Processing time per document. Time spent capturing and extracting one document.
- End-to-end cycle time. Receipt to completion, such as receipt to approval. Extraction can be fast while approvals still take three days, so processing time alone can overstate the gain.
- Time to resolution on exceptions. How long the documents that don't flow straight through take to clear.
Cost
- Cost per document. Tool cost, plus remaining labor for review and exceptions, plus error correction, divided by documents processed. Lido, a vendor, suggests treating a post-automation invoice cost above about $5 as a sign something in the workflow is adding avoidable cost. That's a rule of thumb, not a standard.
- Marginal cost per additional document. How much it costs to process the next 1,000 documents. BP-3 notes cost per transaction falls as automation absorbs higher volume without proportional labor, so this matters most when volume growth is part of your case.
- Documents processed per FTE per month. A capacity measure that shows whether the same team can absorb more volume.
- Hours freed, and where they went. Freed capacity only counts as a return if it's redeployed or avoids new hires.
Quality
- Error rate, by type. A falling total matters less than knowing which errors (transposition, missing fields, misclassification) actually declined.
- Rework and correction cost. Error rate multiplied by the average cost of fixing one.
- First-time-right rate. APQC's public AP measures include the percentage of disbursements that are first-time error-free.
Automation Depth
- Straight-through processing (STP) rate. The share of documents needing zero human touch.
- Exception rate. The share needing manual intervention.
- Human review rate. With confidence-based routing, the share of fields or documents flagged for review, which shows whether the system is confident where it should be.
Reading STP Rate and Accuracy Together
A rising straight-through rate is only a gain if accuracy holds. Track an escaped error rate: errors found downstream or in audits, divided by documents that were processed without review. If STP climbs while escaped errors climb too, the system is passing through documents it shouldn't. Measure accuracy by sampling processed documents against the source, and read STP, exception rate, and escaped errors as one set. Time savings and STP also move independently: one Infrrd deployment reported an 80% reduction in processing time alongside 39% straight-through processing.
Cash and Financial Impact
- Early-payment discounts captured and late fees avoided. In payables, faster processing pays off through these, not by paying earlier by default.
- Time to cash. In receivables and quote-to-cash workflows, a shorter cycle accelerates cash directly.
- Payback period and ROI. Covered in the formulas below.
Risk and Compliance
- Audit findings and compliance violations before and after.
- Audit preparation time. How long it takes to reconstruct a document's history.
- Duplicate and erroneous payments caught. Measured against your own history rather than an industry figure.
People and Adoption
- Adoption rate. Whether staff actually use the redesigned workflow.
- Stakeholder satisfaction. Mitratech, a contract automation vendor, lists it among its core metrics for document automation.
Metrics That Vary by Workflow
- Accounts payable. Cost per invoice, exception rate, discounts captured, late fees avoided.
- Contracts. Drafting and review cycle time, external legal spend, and contract value retention, per Mitratech's metric set.
- Lending. Loan cycle time. BP-3 says loan processing automation often shows the highest returns in financial services, with cycle time reductions of 60% to 80%, a consultancy claim worth testing against your own volumes.
- Claims and healthcare administration. Administrative cost per claim, accuracy, and compliance findings, which BP-3 names as the main value areas.
- Onboarding and verification. Time to complete, completion rate, and manual review volume (a recommended set rather than a sourced benchmark).
Indirect and Strategic
- Decision velocity, revenue per employee, and customer lifetime value. BP-3 and Pathnovo cite these. They're real but hard to attribute to one project, so report them separately from the direct metrics rather than folding them into the headline ROI.
If you can only track three, one AP KPI guide recommends cost per document, cycle time, and STP rate, and a vendor's five-KPI list also includes all three.
How to Collect the Data
A metric you can't measure isn't a metric. Before launch, confirm where each number will come from.
- Cycle time and processing time need a timestamp at each stage (received, extracted, reviewed, approved, completed). If the workflow doesn't log these, add logging before go-live.
- Cost per document needs finance to supply loaded labor rates and the tool's actual invoiced cost.
- Error rate needs a sampling method, such as auditing a fixed percentage of documents each month against the source.
- Exception and review rates come from the workflow's own routing logs.
- Baseline data often lives in different systems (ERP, ticketing, spreadsheets), so assign an owner to pull it before anything changes.
The Formulas
- Cost per document = (tool cost + remaining labor for review and exceptions + error correction cost) ÷ documents processed.
- STP rate = documents with zero human touch ÷ total documents.
- Exception rate = documents needing manual intervention ÷ total documents.
- Error correction cost = error rate × documents × average cost to correct one.
- ROI (%) = (total annual benefit − total annual cost) ÷ total annual cost × 100.
- Payback period (months) = total one-time investment ÷ monthly net benefit.
An Illustrative Calculation
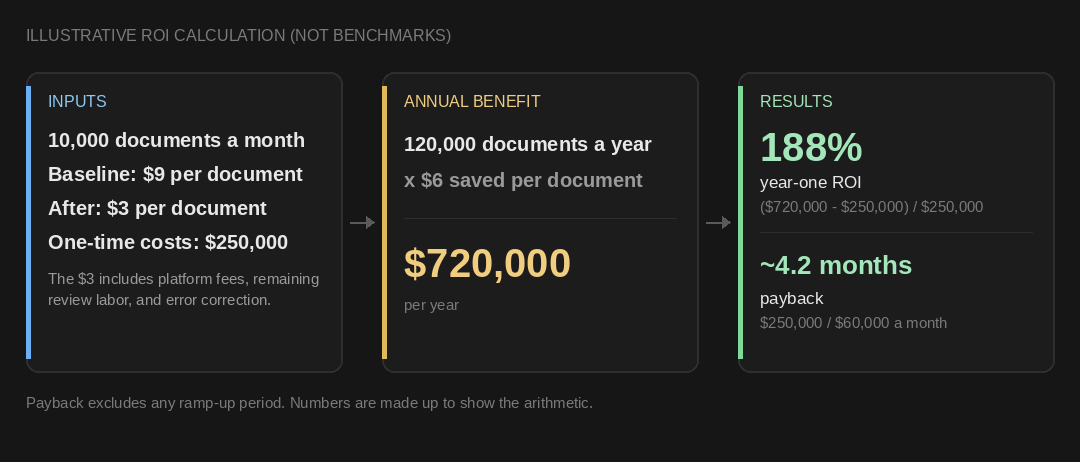
The numbers below are made up to show the arithmetic, not benchmarks. Suppose a team processes 10,000 documents a month at a baseline of $9 each. After automation, the fully loaded cost is $3 per document, including platform fees, remaining review labor, and error correction. One-time costs (implementation, integration, training) total $250,000.
- Annual volume: 120,000 documents.
- Annual benefit: $6 saved × 120,000 = $720,000.
- Year-one ROI: ($720,000 − $250,000) ÷ $250,000 = 188%.
- Payback: $250,000 ÷ $60,000 a month ≈ 4.2 months, before any ramp-up period.
The $3 per document already includes platform fees, so the ROI here is measured against one-time costs only. If you count ongoing costs separately, divide by total annual cost instead.
Hard Savings Versus Soft Savings
This is a recommended practice, not a vendor claim. Separate benefits into two groups so the ROI case survives scrutiny.
- Hard savings show up in a budget line: avoided hires, reduced overtime or outsourcing, discounts captured, late fees avoided, lower error correction spend.
- Soft savings are capacity freed but not yet converted, such as hours saved that haven't been redeployed or absorbed into growth.
Report hard savings as the headline ROI and soft savings as upside, then convert soft to hard by naming what the freed capacity will absorb.
Count the Costs Teams Forget
A Floowed guide lists what many business cases leave out: change management, training, workflow redesign, data quality remediation, integration development, and ongoing model maintenance. Leaving these out inflates ROI and shortens payback. Paperwise makes the opposite point about the benefit side: total savings are almost always underestimated because teams count direct labor and miss broader categories such as the time spent retrieving documents.
When the Returns Arrive
Sources disagree on speed. Ripcord says gains tend to be immediate once digitization is paired with extraction and validation, while others frame returns as a timeline that builds. Model for uncertainty instead of picking a side.
- Build three cases: conservative, expected, and optimistic, with different automation rates and ramp periods.
- Include a ramp-up period in year one, since early months typically carry both implementation effort and partial benefits.
- Use a multi-year view. BP-3 quotes returns over three years, and a longer horizon fits one-time costs better than a year-one snapshot.
- Discount future benefits if finance requires a net present value calculation, using the organization's standard rate.
Where the Savings Come From
Floowed, a vendor, models the mix of benefits as 70% to 85% labor cost reduction, 10% to 15% error reduction, and 5% to 15% compliance risk reduction. Treat that as one vendor's model, not a norm, but it's a useful reminder to measure all three and not assume labor is the whole story.
What the Published Statistics Say
Accounts payable has the best-documented benchmarks, mostly from Ardent Partners' AP Metrics That Matter in 2025, a compilation of its most-used AP benchmarks drawn from its State of ePayables 2024 report. As summarized by secondary sources that agree with each other:
- Cost per invoice. $9.40 on average versus $2.78 for best-in-class teams, a gap of about 3.4 times.
- Cycle time. 9.2 days on average versus 3.1 days for best-in-class.
- Touchless processing. 32.6% on average versus 49.2% for best-in-class.
- Exception rate. 14% on average and 9.0% for top performers, against 22% for teams without automation.
Two cautions. First, other sources cite different values for the same benchmark family (for example, $9.84 and $10.89 per invoice), and older APQC data puts the median near $5.80, with the top quartile near $2 and the bottom quartile at $10 or more. Second, that benchmark family covers invoices only.
Published ROI claims for document automation broadly are far more scattered, and nearly all come from vendors:
- First-year ROI of 30% to 200% (Pathnovo), 200% to 400% (Floowed), and 200% to 400% over three years for financial services process automation (BP-3).
- Payback in 3 to 6 months (Floowed) and ROI of 150% to 200% within 18 months (Pathnovo).
- A 75% to 92% reduction in cost per document (Pathnovo).
- One Infrrd deployment reporting an 80% cut in processing time with 39% straight-through processing.
They conflict because the baselines differ (invoice processing cost is cited anywhere from about $5.80, an older APQC median across all organizations, to $12 to $20, one vendor's manual benchmark), what's counted as a cost differs, and the samples are self-selected success stories. Use them to sanity-check your model, not to replace it. Your own baseline is the only benchmark that matches your documents.
Measurement Cadence and Attribution
- Re-measure the same metrics after go-live, then at intervals such as 30, 60, and 90 days and quarterly afterward. Timing varies, so let your own re-measurement show whether the gains are immediate or building, and update the model with what you find.
- Isolate the automation effect. Compare like-for-like volumes and periods, and separate the effect of the tool from process redesign, staffing changes, or seasonality.
- Report direct and indirect benefits separately. Time, cost, and error metrics are direct. Decision velocity and customer lifetime value are indirect and easier to challenge.
- Update the ROI model with actuals. Replace projected savings with measured ones as data arrives.
Conclusion
A credible ROI case for document workflow automation covers speed, cost, quality, automation depth, cash impact, risk, and adoption, measured against a baseline you captured before launch and set against the full cost of implementation, not just the license. Straight-through rate only counts when accuracy holds, hard savings should lead the case, and returns should be modeled as ranges. Published statistics are useful for orientation, but they're mostly vendor-authored, they conflict, and they rarely match your documents, so the strongest evidence is your own before-and-after data, re-measured over time.
FAQ
What are the most common metrics for measuring document workflow automation ROI?
Cost per document, processing time, end-to-end cycle time, straight-through processing rate, exception rate, error rate, and payback period. One AP KPI guide recommends cost per document, cycle time, and STP rate as the three to track if you can only track three.
How do you calculate document automation ROI?
ROI (%) = (total annual benefit − total annual cost) ÷ total annual cost × 100. Include one-time costs such as implementation, integration, and training alongside ongoing platform and maintenance costs, and count benefits beyond labor, such as error correction and compliance.
What is a straight-through processing rate, and why isn't it enough on its own?
It's the share of documents that move through the workflow with zero human intervention. A high rate only counts as a gain if accuracy holds, so track escaped errors (errors found downstream on documents processed without review) alongside it.
What's the difference between hard and soft savings?
Hard savings appear in a budget line, such as avoided hires or discounts captured. Soft savings are capacity freed but not yet converted. Lead with hard savings in the ROI case and report soft savings as upside.
How long should payback take?
Published claims range from a few months to well over a year, mostly from vendors. Your own payback depends on volume, baseline cost, and one-time implementation costs, so model conservative, expected, and optimistic cases rather than relying on a quoted range.
Why do ROI statistics vary so much between sources?
They use different baselines, count different costs, and mostly come from vendors describing their own best results. Even the same underlying benchmark appears with different values across secondary sources, so anchor to your own baseline.
Can I measure ROI for indirect benefits like decision speed?
You can track them, but they're harder to attribute to a single project. Report them separately from direct metrics such as cost, time, and error rates so the headline ROI stays defensible.
More articles
API for Utility Bill and Multi-Service Statement Processing (2026)
How document processing APIs handle utility bills and multi-service statements: how the market splits, schema design, validation, and named options.
PDF Conversion APIs for Document Processing: A 2026 Comparison
PDF conversion APIs for document processing platforms compared: HTML to PDF, Office conversion, self-hosting, pricing, and named providers.